
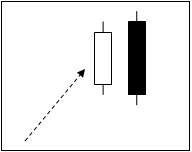
The piercing pattern often will end a minor downtrend (a downtrend that often lasts between five a fifteen trading days) The day before the piercing candle appears, the daily candle should
-
-
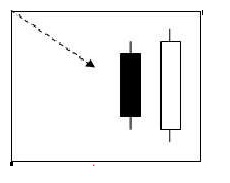
On the dark cloud cover day, the stock closes at least halfway into the previous white capping candle. The larger the penetration of the previous candle (that is , the closer this candle is a being
-
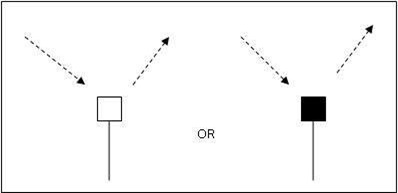
A bearish engulfing candle occurs after a significant uptrend. Again, the shadows need not be surrounded. In order for the Bullish Engulfing signal to be valid, the following conditions must
-
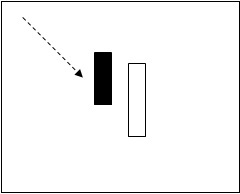
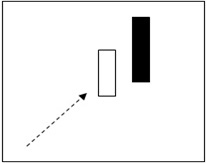
A bullish engulfing candle occurs after a significant downtrend. Note that the engulfing candle must encompass the real body of the previous candle, but need not surround the shadow. In order for
-
The hammer puts in its appearance after prolonged downtrend. On the day of the hammer candle, there is strong selling, often beginning at the opening bell. As the day goes on, however, the market
-
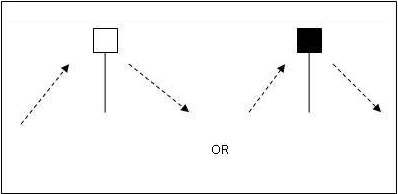
The hangman candle, so named because it looks like a person who has been executed with legs swinging beneath, always occurs after an extended uptrend The hangman occurs because traders, seeing a
-
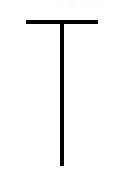
A “Dragonfly” doji depicts a day on which prices opened high, sold off, and then returned to the opening price. Dragonflies are fairly infrequent. When they do occur, however, they often
-
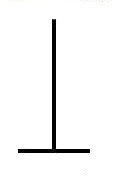
A “gravestone doji” as the name implies, is probably the most ominous candle of all, on that day, price rallied, but could not stand the altitude they achieved. By the end of the day. They came
-
A “long-legged” doji is a far more dramatic candle. It says that prices moved far higher on the day, but then profit taking kicked in. Typically, a very large upper shadow is left. A close
-
